Leveraging the Price Slide: A Marketing Opportunity Amid Record-High Prices

April 3, 2025
2024 was a year characterized by record-setting prices in both feeder and fed cattle markets, a trend that has continued through the beginning of the new year. Nebraska receipts for 750- to 800-pound steers averaged $269.59 per hundredweight ($/cwt) in 2024, a near $40/cwt increase from the previous year. The reduced supply from consecutive years of herd liquidation has fueled the feeder calf market across all weight classes, driving prices to unprecedented levels. Despite historically high price levels, the current market valuation of cattle across weight classes suggests an opportunity to capture additional value on a per-head basis.
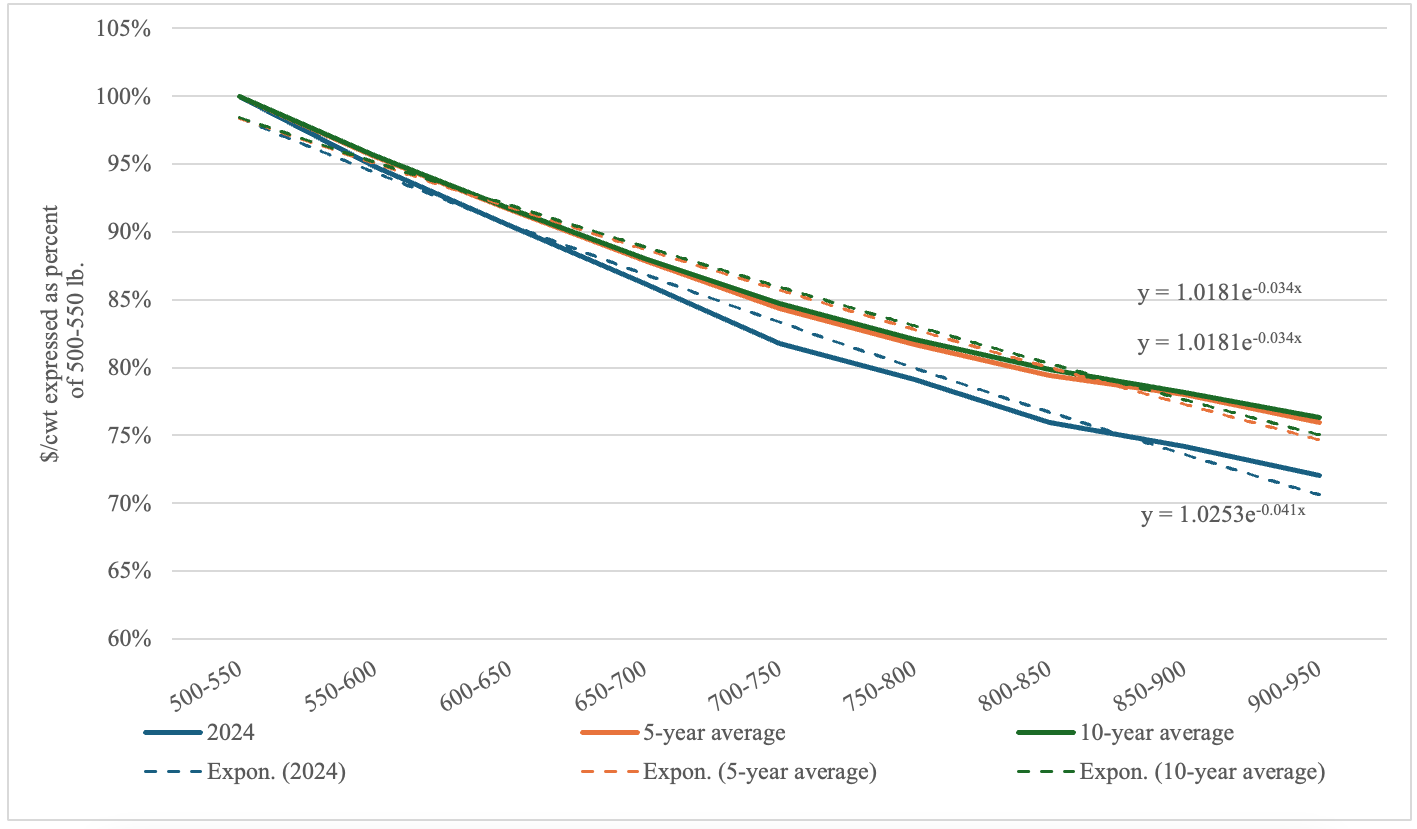
The market price discount, commonly known as the price slide, refers to when lighter-weight calves command higher prices per pound compared to heavier calves of similar type and kind. In general, this occurs due to diminishing marginal feed efficiency, or the incremental rate at which an animal converts feed into weight gain. As with any specie, nutrient utilization is most efficient earlier in an animal’s life, making weight gain at heavier weights more costly. Although heavier calves generate a larger value per head, the resulting discount dilutes that value, making the additional weight worth less on a per-pound basis. The “slide,” shown graphically in Figure 1, illustrates the inverse relationship between price and weight—a relationship that is not constant relative to price fluctuations. The slope of the price slide varies from year to year and across months due to the seasonality of feeder cattle supply and placement demand. However, it is highly correlated with corn prices, a key feed input and major factor in feedlot cost of gain. The price-weight relationship at specific weight classes conveys important market signals.
Figure 1 shows the average price slide for 2024, as well as the five- and 10-year averages, along with their linear approximations expressed as a percentage of the 500-550 $/cwt price. The line representing the 2024 average price slide is notably steeper. A closer look reveals that the 2024 slide begins to flatten at the higher weight classes, particularly at 700-750 pounds, and even more so at 800-850 pounds. The historical slides exhibit similar breaks, but their magnitude is far less than that observed in 2024. The steep slope in 2024 slide reflects greater demand for lighter-weight placements compared to the five- and 10-year averages.
Figure 1. Price Slide, Nebraska Feeder Steers (Medium and Large 1)
Source: USDA-LMIC, Authors Calculations

The slope of the line reflects the market discount across different weight classes. Stated simply, the steeper the slope, the greater the discount per pound. When marketing feeder cattle, it is important to consider the discount across all weight classes relative to the marginal value of additional weight. When the slide is flatter or nearly horizontal, the marginal value of additional weight is higher compared to steeper portions of the slide. Adding weight post-weaning is profitable when the marginal value exceeds the marginal cost (i.e. cost of gain). Table 1 presents the marginal value for each weight class based on the average price slide for 2024. The 700–750-pound weight class had the highest marginal value at $1.69 per pound for a 50-pound weight gain, aligning with the visual observations of the price slide discussed earlier.
It is important to note that the figures presented in Table 1 represent the average for Nebraska in 2024, but the price-weight relationship can vary across months and by location. Producers who plan to add weight before marketing feeder calves should consider calculating the value of gain relative to weaning weight to capture additional value per head from market price discounts. Even amidst record-high prices, determining the cost of gain and developing a marketing strategy to best leverage the price slide remains an essential tactic for maximizing per-head value. Online resources, such as Beef Basis, can assist in calculating the value of gain for your operation while also providing valuable marketing insights.
Table 1. Marginal value per pound comparison, 2024 Nebraska Feeder Steers (Medium and Large 1)
Source: USDA-LMIC, Authors Calculations
| Weight | ||||||||
| 525 | 575 | 625 | 675 | 725 | 775 | 825 | 875 | 925 |
| Panel (a): Value/head ($) | ||||||||
| 1,901.55 | 1,948.39 | 1,990.56 | 2,012.51 | 2,076.04 | 2,160.70 | 2,241.86 | 2,293.99 | 2,376.97 |
| Panel (b): Gain relative to 525 (lbs.) | ||||||||
| – | 50 | 100 | 150 | 200 | 250 | 300 | 350 | 400 |
| Panel (d): Marginal Value of Gain ($/lb.) | ||||||||
| – | 0.94 | 0.89 | 0.74 | 0.87 | 1.04 | 1.13 | 1.12 | 1.19 |
| – | 1.78 | 1.11 | 1.16 | 1.30 | 1.36 | 1.31 | 1.36 | |
| – | 0.44 | 0.85 | 1.13 | 1.26 | 1.21 | 1.29 | ||
| – | 1.27 | 1.48 | 1.53 | 1.41 | 1.46 | |||
| – | 1.69 | 1.66 | 1.45 | 1.50 | ||||
| – | 1.62 | 1.33 | 1.44 | |||||
| – | 1.04 | 1.35 | ||||||
| – | 1.66 | |||||||
TaraLee Hudson and Elliott Dennis discuss price slides in cattle markets and their implications for producers.


